Posts

Showing posts with the label Panorama How-To

Oracle-DB: Find SQLs that are missing partition pruning even if it could be possibly used

Image
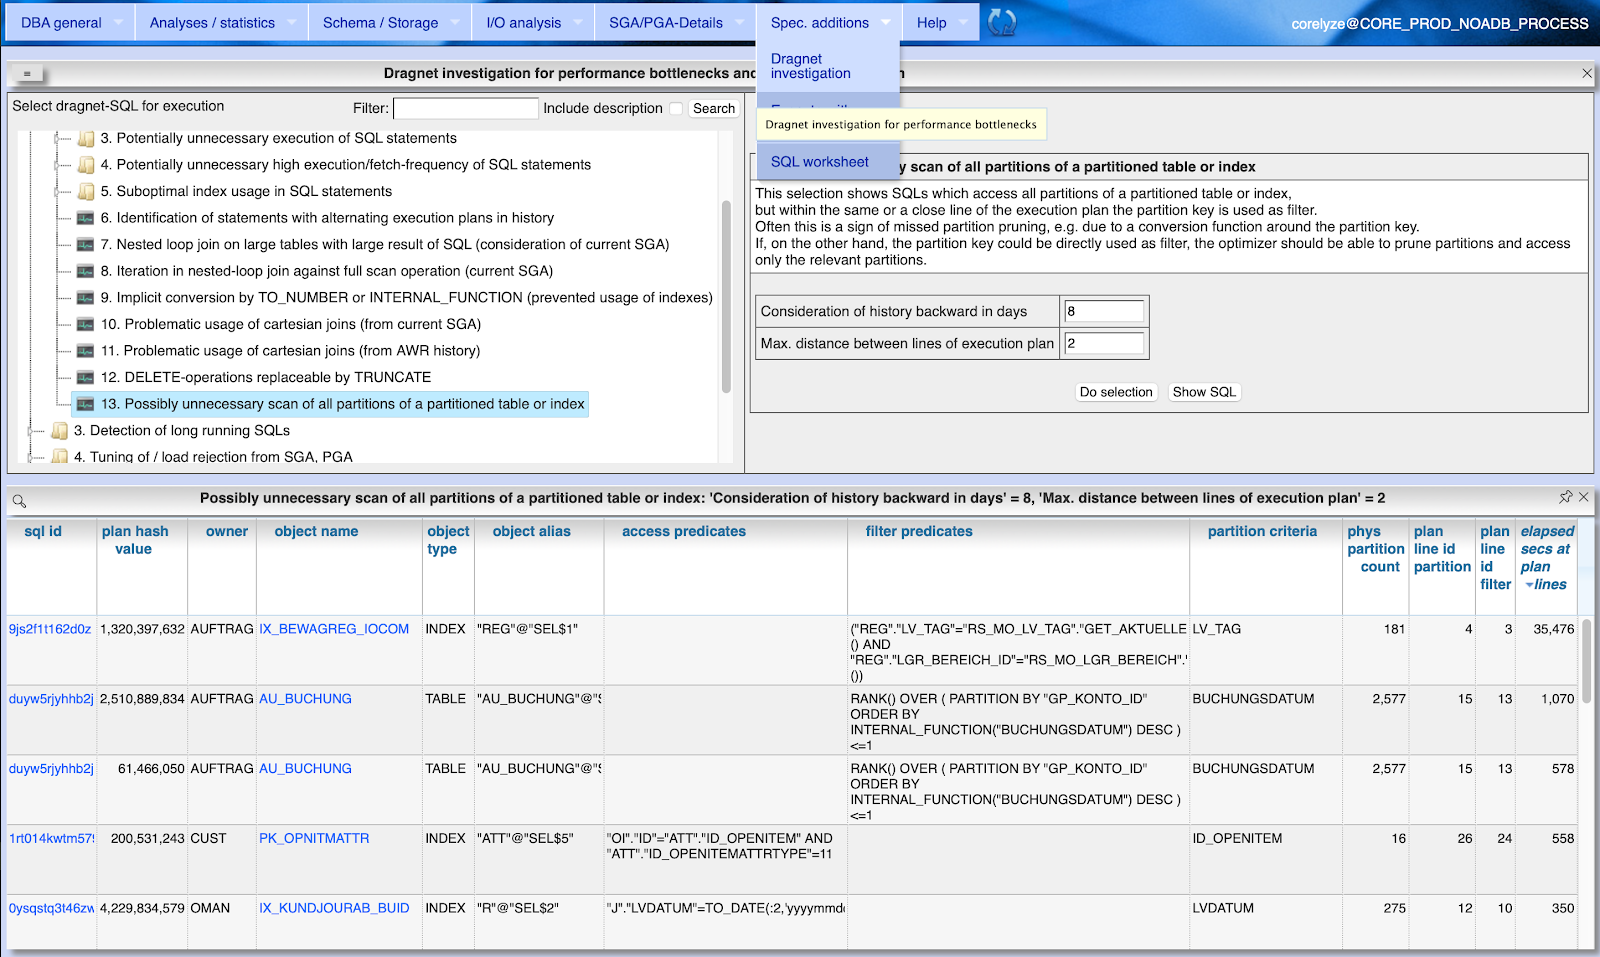
Some times a SQL execution includes all partitions of a partitioned table or index into processing, although there are filter conditions used that contain also the partition key of that partitoned table or index. There are several possible reasons why the optimizer does not recognize that access could be reduced to one or less partitions (a.k.a. partition pruning): The partition key can be obfuscated behind a conversion function The partition key can be compared to a function result that is known only at execution time Being able to use partition pruning can make a huge difference for execution time of the SQL. Imagine you only need to scan one partition of a table instead of several thousands. Often only a small change in the SQL statement can drive the optimizer to use partition pruning. A small example where all partitions are scanned due to comparison of the partition key with a function result: Get the sum of order value for a table interval partitioned by day. SELE

Oracle-DB: How to evaluate the "hint_usage" section of column OTHER_XML in execution plan

Image
What does the database really do with your optimizer hints in SQL statements? Starting with Oracle 19c the column 'OTHER_XML' of V$SQL_Plan rsp. DBA_Hist_SQL_Plan or Plan_Table was extended by a section 'hint_usage'. This gives information about the state of optimizer hint usage correlated with the line in the execution plan. Example for section 'hint_usage' of OTHER_XML Lets take this simple but useless SQL as example: SELECT /*+ FULL(c) QB_NAME(Outer) NONSENS(c) */ * FROM cust.Customer c WHERE ID_Company IN ( SELECT /*+ USE_NL(cp) QB_NAME(Inner) */ 12 FROM sysp.Company cp WHERE RowNum < 5 ) AND RowNum < 20; The section 'hint_usage' in PLAN_TABLE.OTHER_XML looks like for this example: <hint_usage> <q> <n><![CDATA[INNER]]></n> <h o="EM"> <x><![CDATA[QB_NAME(Inner)]]></x> </h> <

Oracle-DB: Real-time monitoring dashboard in Panorama

Image
In addition to various functions, the free performance analysis tool  Panorama now also offers a browser dashboard for real-time monitoring of Oracle database performance. This shows key indicators for active sessions by wait class as well as top sessions and top SQLs in considered time period. Several values within this dashboard are presented as links which allow to dig in deeper using Panorama's  standard analysis workflows.  Choose menu entry "DBA general"/"Dashboard", the time to cover until now and a refresh rate: As long as gv$Active_Session_History has retrospective data it is shown in the graph for the chosen time period grouped by wait class. At next refresh time only the delta since last refresh is transferred from gv$Active_Session_History to your browser instance. Investigate a particular time period within the presented data The top sessions and SQLs are related to the current time frame you can select within the chart. If you select a particular

Oracle-DB: Retrospective analysis of blocking locks with Panorama

Image
The recorded session activity in Oracle databases (Active Session History / ASH) enables the retrospective analysis of locking scenarios between database sessions. This post shows how the free performance analysis tool  Panorama  supports this investigation. Precondition for using ASH is the Enterprise Edition of Oracle DB and the licensing of the Diagnostics Pack. If you don't have licensed Diagnostics Pack or you are running Standard or Express Edition, then you can use the similar function of Panorama-Sampler to record the session activity. Panorama evaluates both sources (AWR/ASH or Panorama-Sampler) transparently in the same way. In general there are several ways in Panorama for retrospective evaluation of previous blocking lock situations: Top down analysis of lock dependency tree to identify a root blocking session Top down analysis of wait event dependencies to get an overview based on blocking and blocked events (new in Panorama) Bottom up analysis to find the root cause

Oracle-DB: Identify non-relevant indexes for secure deletion

Image
A sensitive issue for DBAs and developers is often the detection and removal of indexes in Oracle databases that are not or no longer needed. In practice systems can be found that allocate more than 50% of the storage with indexes without any productive relevance. Nevertheless, this potential for a simple reduction of storage requirements and system load is regularly not used, freely after "never touch a running system" or "why should I burn my fingers here and then this index is still needed somewhere". This article demonstrates how to securely determine irrelevant indexes using the freely available analysis tool " Panorama ". Why define indexes on tables Optimizing accesses from User-SQL - Reduction of access to the result-relevant records when reading table data Guarantee of uniqueness - Declaration of unique indexes or use of the index for primary key or unique constraints Protection of Foreign Key Constraints - Preventing full table scans w

Using Panorama for autonomous database in Oracle cloud

Panorama is now able to connect to autonomous databases in the Oracle cloud. At start of Panorama you must ensure that environment variable TNS_ADMIN targets to a directory containing: the tnsnames.ora provided by Oracle cloud the unzipped files from the Oracle wallet provided by Oracle cloud: Oracle wallet files (ewallet.sso, ewallet.p12)  Java KeyStore (JKS) files (truststore.jks, keystore.jks). Connection properties required to use Oracle Wallets or Java KeyStore (ojdbc.properties)

Panorama: List Oracle trace files and it's content

Image
Starting with Release 12.2 of Oracle database you can list and view trace files from database server file system by SQL selects. Dynamic performance views for representation of trace files are: V$DIAG_TRACE_FILE: lists files from ADR (automatic diagnostic repository) V$DIAG_TRACE_FILE_CONTENTS: lists text content of trace files with one record per line Panorama now supports viewing server side trace files via menu "DBA general" / "Server Files" / "Server Trace Files". This way people without access rights on database server file systems (like software developer) are enabled to access the trace files they produce by their own. This view shows all existing trace files for chosen period and optional including or excluding patterns for trace file name. This works for server trace files as well as for user trace files created by: ALTER SESSION SET SQL_TRACE=TRUE; or ALTER SESSION SET EVENTS '10046 trace name context forever, level 4|8|12'

Panorama: Configure https access to Docker container with Nginx

The Oracle performance analysis app Panorama as Docker container does not natively support https-connections. But securing http-access to Panorama can easily be reached by running the Panorama-container behind a reverse proxy. This example shows using Nginx as reverse proxy and docker-compose to place Panorama behind the reverse proxy. I've used already existing own SSL-certificates for the target host. Obviously you may want to use certificates generated by Lets Encrypt  but this often doesn't work in company environments behind firewalls. Place the pem- and key-file of your certificate combined with the two files "docker-compose.yml" and "nginx.conf" in one directory and run "docker-compose up" to start Panorama and Nginx. Example for nginx.conf (replace certificate file names): # Nginx config for Panorama # Peter Ramm, 22.03.2019 events { } http { # Redirect all http traffic on port 80 to https 443 server { listen 80 def

Oracle-DB: OLTP-Compression - what's true and what's wrong

Image
Update 2023-05:  Checked the above issues against Rel. 19.18 It works much better now than before in Rel. 12.x.  Not completely without the risk of getting migrated rows and not deterministic at all. But with much smaller amount of situations resulting in increasing storage footprint and migrated rows.

Panorama: Evaluate SGA memory usage and resize operations for Oracle DBs

Image
Starting with release 10.1 Oracle introduced automatic shared memory management. Setting only SGA_TARGET=x without defining limits for the SGA-components (buffer cache, shared pool, large pool, java pool) allows your database to redistribute SGA memory between components due to current needs. This will work properly in many cases but sometimes there are some pitfalls: A very common problem on Oracle databases are applications without usage of bind variables in their SQL statements. Not using bind variables leads to excessive SGA memory consumption in shared pool and parse effort if you have a large number of SQLs executed with different values in filter conditions stored as literals. For example: SELECT a, b FROM Item WHERE ItemNo = 453612; SELECT a, b FROM Item WHERE ItemNo = 876886; etc. instead of SELECT a, b FROM Item WHERE ItemNo = :ItemNo; In such a situation the DB may resize the SGA. The size of the shared pool will grow thus reducing the size of the buffer cache

Oracle-DB: Evaluation of recorded SQL-Monitor reports with Panorama

Image
SQL-Monitoring records individual executions of an SQL statement in detail if they fulfill one of the following prerequisites: Execution with parallel query CPU- or I/O-activity for more than 5 seconds Optimizer-hint `MONITOR` in SQL statement SQL-Monitoring reports are stored in table v$SQL_Monitor during SQL execution and for a very short period after execution. The precondition for using the monitoring reports is licensing of the Tuning Pack for the Enterprise Edition. Starting with Oracle 12.1, the short-living detailed monitoring reports from v$SQL_Monitor are also available for a longer time within the AWR retention period via DBA_Hist_Reports and DBA_Hist_Reports_Details. This report can be exported as HTML-page which uses Adobe-Flash to render the Database Activity Report for this SQL execution similar to Enterprise manager. To generate the HTML-report from v$SQL_Monitor call: SELECT DBMS_SQLTUNE.report_sql_monitor(