Posts

Panorama: How to identify and evaluate SQL with different execution plans

Image
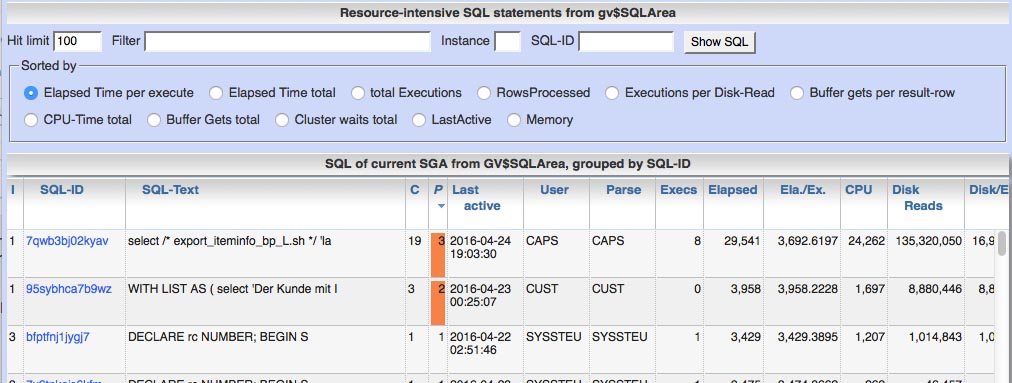
How to identify changing execution plans in Panorama Changing or alternating executions plans often contains the risk of unpredictable runtime for SQL-statements. There are several ways in Panorama to find SQL statements with different execution plans: 1. Lookup into current SGA: If you list SQLs from SGA (Menu „SGA/PGA details“ / „SQL-Area“ / „Current (SQL-ID)“), there’s the fifth column „P.“ in the table which shows the number of different plans in SGA for a SQL-statement (orange background if more than one plan occurred). 2. Lookup into SQL history: If you list historic SQLs from AWR history (Menu „SGA/PGA details“ / „SQL-Area“ / „historic“), there’s also a column „P.“ in the table which shows the number of different plans within the choosen period for a SQL-statement. 3. SQL details page for period in history At the SQL details page you find the number of different execution plans in the considered period at the right upper corner. 4. Complete time line of SQL A

Panorama: How to identify root cause after “ORA-1652: unable to extend temp segment”

Image
If you find this message “ ORA-1652: unable to extend temp segment ” in alert.log there are two alternatives for reason: The session causing the ORA-1652 has allocated large memory in temporary tablespace itself and got ORA-1652 at the end of available space  Other sessions did successfully allocate large amount of memory in temp tablespace but this session with only small demand got ORA-1652  But how to identify the session that really claimed large amounts in temporary tablespace and therefore is responsible for the ORA-1652? With Panorama you can clarify this as follows: Go to menu “Schema / Storage” / “Temp usage” / “Historic”. Choose the concerning period and appropriate time unit.  Sort table by column “Max. TEMP allocated”  Show column “Max. TEMP allocated” in diagram via context menu click in column and select “Show column in diagram”  Now let’s check the temp usage peak at 00:10. One of several ways to identify the sessions causing the peak is: Click

Panorama: Fix changed execution plan with SQL plan baseline

You recognize a long running query caused by poor execution plan. You also know that until yesterday this query worked fine but now execution plan has suddenly changed due to ???. Filipe Martins named a solution here by transferring a good execution plan from AWR history into a SQL plan baseline. This solution is available in Panorama now. It allows you to quickly generate a SQL snippet for creation of SQL plan baseline by simple button click. Steps to fix this issue: Identify the problematic query, open SQL details page in Panorama for this statement. For example via menu “SGA/PGA details” / “SQL Area” / “Current” Hit button “Complete time line of SQL” at the bottom of the SQL details page Identify a day (or hour/minute) in history in the list with exactly one good execution plan. Column “Elapsed/Execution” may help you to rate the quality. Column “Plan hash value” allows you to differentiate different plans. Click the link in column “Start time” to open SQL de

Panorama: User is enabled to add personal SQL to dragnet list

Image
In menu ‘Spec. additions’ / ‘Dragnet investigation’ now you have the opportunity to add your own personal SQL-statements to the predefined list of dragnet SQLs. This SQLs are stored at Panorama’s server instance and are available for your personal browser instance only. Choose ‘Add personal selection’ from menu ‘≡’ and customize the JSON template for your purpose. You will get a new menu ‘Personal extensions’ in your list of SQLs then. If you want to persist this SQLs and provide them to all users of your Panorama instance, you can store them as JSON-array in a file ‘predefined_dragnet_selections.json’ stored at PANORAMA_VAR_HOME. The content of file ‘predefined_dragnet_selections.json’ is shown in list of dragnet SQLs if it exists in   PANORAMA_VAR_HOME directory. Click here to show all opportunities for your personal or global extensions to dragnet list.

Set script name as module/action in V$Session if SQL*Plus-session starts

Setting module and action info via  DBMS_Application_Info.Set_Module  gives valuable context info in V$Session, Active Session History etc. For jobs executing SQL via SQL*Plus mostly needed information in module/action is the name of the process executing sqlplus. To prevent jobs from directly executing  DBMS_Application_Info.Set_Module  and to ensure that every sqlplus-process is setting this context info, you can use the startup-script feature via login.sql. Ensure that environment variable SQLPATH will target to the directory that contains login.sql, so all executions of sqlplus will  immediately set their context info in v$Session. Example for login.sql: -- Description : Default login sequence for SQL*Plus, executed at start time of every SQLPlus-process if file is in search path -- Unix environment variable SQLPATH must contain directory of file "login.sql" SET TERMOUT OFF; -- Determine unique session identifier for unique tempfile name

Monitor/sample values from gv$SesStat in history: monitor transaction count per session in history

In current version of Oracle database there’s no way to breakdown historic statistic values to sessions if session has already terminated. Some times this information is strongly needed to identify bottlenecks. Actual situation was: – massive number of transactions which caused massive small write I/O reaching limits of physical disks – to identify root cause identification fo processes/sessions was needed – consideration can only be done in history with time gap of some hours, problematic sessions have been terminated for long time Solution: Create sampling process with minimal resource impact to CPU and I/O with result storage in database table. Preparation Create two tables, one for result storage and one for abortion of sampling process: CREATE TABLE SessMon_Semaphore (Name VARCHAR2(30)); COMMENT ON TABLE SessMon_Semaphore IS 'Control abortion of sampling process'; COMMENT ON COLUMN SessMon_Semaphore.Name IS 'Record identifier to store record lock on it&

Create SQL trace for unique application by DBMS_MONITOR

Create SQL trace file for systems with connection pool If using connection pools the default SQL_TRACE=TRUE does not help because the DB-connection should only be traced if used for a special considered application. For identification of application you can use the context info set by DBMS_Application_Info.Set_Module. Trace the run of an single application For a special module info you can specify creation of trace file already before execution of this application. Setting trace config has to be done as SYSDBA. In addition you can set parameters for "waits" and "binds", default is FALSE. Examples Activate trace for application by module with recording of bind variables exec DBMS_MONITOR.SERV_MOD_ACT_TRACE_ENABLE(service_name => 'SYS$USERS', module_name => 'ID_Application = 56', binds => TRUE); Deactivate trace for module exec DBMS_MONITOR.SERV_MOD_ACT_TRACE_DISABLE(service_name => 'SYS$USERS', module_n

Analyze affected objects for wait event “library cache: mutex X”

With shown SQLs you can identify objects causing “library cache: mutex X”-waits in library cache. From oracle 11g this problem may be reduced by cloning objects in library cache via DBMS_SHARED_POOL.MARKHOT. Please keep in mind to set the exact namespace in call of DBMS_SHARED_POOL.MARKHOT, for PL/SQL packages it has to be called twice for package and body. View on Active Session History from current SGA: SELECT COUNT(*) Seconds_in_Wait, obj.NameSpace, h.Inst_ID, o.Owner, o.Type, o.Name, ROUND(AVG(Time_Waited)/1000,2) Avg_Time_waited_ms, MIN(Sample_Time) First_Sample, MAX(Sample_Time) Last_Sample FROM gv$Active_Session_History h LEFT OUTER JOIN gv$DB_Object_Cache o ON o.Hash_Value = h.P1 AND o.Inst_ID = h.Inst_ID LEFT OUTER JOIN DBA_Objects obj ON obj.Owner = o.Owner AND obj.Object_Name = o.Name AND obj.Object_Type = o.Type WHERE Event = 'library cache: mutex X' GROUP BY h.Inst_ID, o.Owner, o.Type, o.Name, obj.NameSpace HAVING COUNT(*) &g

Caching of frequently used static master data (post 11g, using RESULT_CACHE)

frequent access on small tables includes risk of hot blocks in db-cache, especially if tables are mass-joined by nested loop operations Joining this master tables by hash joins reduces number of block access in db cache, but requires large data transfer for hash operations and possibly access to TEMP tablespace Often these master data may be cached in local DB session, for session pooling environment or long living sessions in addition with content aging for guaranteed currentness of data This example shows a PL/SQL package for caching of table data with 11g-feature “function result caching” For usage runtime measuring should be done to decide between these caching or usage of hash joins p.s.: More effective than this solution may be caching master data within application layer without access to PL/SQL CREATE OR REPLACE PACKAGE Cache_TableAlias AS -------------------------------------------------------------------------------- -- Author : %$LastChangedBy: arosenfe $derived

Caching of frequently used static master data (pre 11g)

frequent access on small tables includes risk of hot blocks in db-cache, especially if tables are mass-joined by nested loop operations Joining this master tables by hash joins reduces number of block access in db cache, but requires large data transfer for hash operations and possibly access to TEMP tablespace Often these master data may be cached in local DB session, for session pooling environment or long living sessions in addition with content aging for guaranteed currentness of data This example shows a PL/SQL package for caching of table data without 11g-feature “function result caching” For usage runtime measuring should be done to decide between these caching or usage of hash joins From 11g function result caching may be used instead of this solution p.s.: More effective than this solution is caching master data within application layer without access to PL/SQL CREATE OR REPLACE PACKAGE Cache_TableAlias AS ----------------------------------------------------------

Measure average I/O-load and CPU-usage on Oracle database instance

Short overview on peak I/O requests, transfer volume and CPU-usage for given time range. Based on average values within AWR-cycle. SELECT /* DB-Tools Ramm average system load */ Instance_Number, MIN(Begin_Time) Start_Range, MAX(End_Time) End_Range, MAX(Phys_Write_Total_kB_per_Sec) Max_Phys_Writes_kB_per_Sec, MAX(Begin_Time) KEEP (DENSE_RANK LAST ORDER BY Phys_Write_Total_kB_per_Sec) Max_Write_per_Sec_BeginTime, MAX((End_Time-Begin_Time)*1440) KEEP (DENSE_RANK LAST ORDER BY Phys_Write_Total_kB_per_Sec) Cycle_Minutes_1, MAX(Phys_Read_Total_kB_per_Sec) Max_Phys_Read_kB_per_Sec, MAX(Begin_Time) KEEP (DENSE_RANK LAST ORDER BY Phys_Read_Total_kB_per_Sec) Max_Read_per_Sec_BeginTime, MAX((End_Time-Begin_Time)*1440) KEEP (DENSE_RANK LAST ORDER BY Phys_Read_Total_kB_per_Sec) Cycle_Minutes_2, MAX(Phys_Write_IO_per_Sec)

Measure average system load on oracle database instance

Short overview over utilization of DB system. Lists average and peak values for every instance (in case of RAC) for given time range: – Total number of active DB sessions – Number of active DB sessions on CPU (no other wait event) Value and timestamp are shown for: – maximum peak load – average load over total time range – maximum average load over one minute – maximum average load over one hour SELECT /* DB-Tools Ramm average system load */ Instance_Number, MIN(Sample_Time) Start_Range, MAX(Sample_Time) End_Range, MAX(Active) Max_Active, MAX(Sample_Time) KEEP (DENSE_RANK LAST ORDER BY Active) Max_Active_Sample_Time, MAX(CPU) Max_CPU, MAX(Sample_Time) KEEP (DENSE_RANK LAST ORDER BY CPU) Max_CPU_Sample_Time, ROUND(AVG(Active),1) Avg_Active