Panorama: How to identify and evaluate SQL with different execution plans
How to identify changing execution plans in Panorama
Changing or alternating executions plans often contains the risk of unpredictable runtime for SQL-statements.There are several ways in Panorama to find SQL statements with different execution plans:
1. Lookup into current SGA:
If you list SQLs from SGA (Menu „SGA/PGA details“ / „SQL-Area“ / „Current (SQL-ID)“), there’s the fifth column „P.“ in the table which shows the number of different plans in SGA for a SQL-statement (orange background if more than one plan occurred).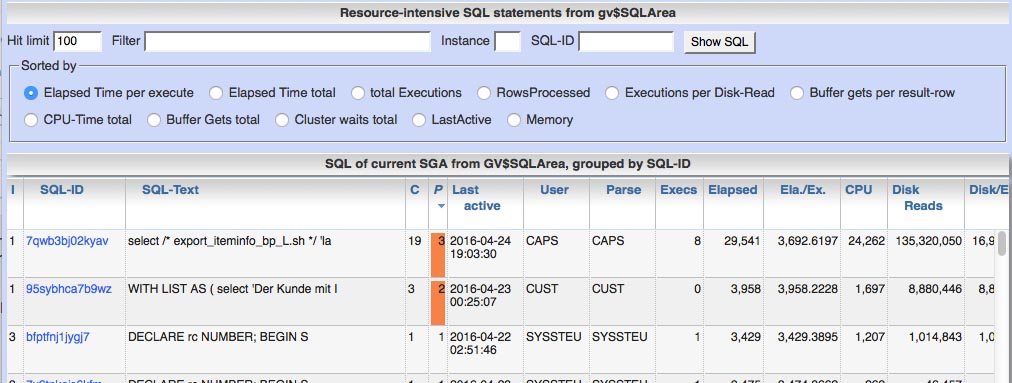
2. Lookup into SQL history:
If you list historic SQLs from AWR history (Menu „SGA/PGA details“ / „SQL-Area“ / „historic“), there’s also a column „P.“ in the table which shows the number of different plans within the choosen period for a SQL-statement.3. SQL details page for period in history
At the SQL details page you find the number of different execution plans in the considered period at the right upper corner.
4. Complete time line of SQL
At the bottom of the SQL details page (current SGA or historic) you find a button „Complete time line of SQL“.Clicking this button shows a list with the whole AWR-history of a SQL statement grouped by various time units.
This list also contains a columns „Plans“ with the number of different execution plans plans in this time slot.

5. Direct search for changing execution plans
In menu „Spec. additions“ / „Dragnet investigation“ you find a selection „Identification of statements with alternating execution plans in history“ at point 2.6.This selection allows you to scan your system for SQLs with changing execution plan, sorted by relevance (difference between best and worst plan per execution).

How to evaluate differences between execution plans
Compare execution plans for a time period of the SQL statementAt the bottom of detail page for historic SQLs you have a button “Execution-Plan (n)”.
If your SQL has multiple plans in considered period, than this function shows you all these plans with some runtime statistics.Differences between these plans are marked with orange or red background at line level.
So this supports you in finding the differences also for large execution plans.


Usage hint: To access a period with more than on execution in SQL details page you can use the list “complete time line of SQL” and group the history by “month”.
Than clock on column “Start time” and your SQL details page embraces the whole month.
Check possible reasons for multiple execution plans in SGA
At the bottom of current SQL detail page from SGA you have a button “Cursor sharing (n versions)”.This function shows you the reasons for existence of separate child cursors for your SQL, which may also lead to different execution plans.


Comments
Post a Comment