Posts

Panorama: Oracle-DB's Performance-Hub report now integrated

Image
Starting with release 12.1 the Enterprise Manager Express of Oracle-DB contains an aggregated view of performance metrics called "Performance Hub". Panorama , the free tool for performance analysis on Oracle-DB now also includes this Performance-Hub report. You may call the Performance Hub report by menu "Analysis / Statistics" / "Genuine Oracle AWR-reports" / "Performance Hub". After setting start and end date and optional RAC-instance the Performance Hub report opens in a discrete browser tab (if you allow Adobe Flash to execute). The DB-user used for connecting Panorama to the database needs the role EM_EXPRESS_BASIC or DBA to be able to call the Performance Hub report.

Oracle-DB: OLTP-Compression - what's true and what's wrong

Image
Update 2023-05:  Checked the above issues against Rel. 19.18 It works much better now than before in Rel. 12.x.  Not completely without the risk of getting migrated rows and not deterministic at all. But with much smaller amount of situations resulting in increasing storage footprint and migrated rows.

Panorama: Evaluate SGA memory usage and resize operations for Oracle DBs

Image
Starting with release 10.1 Oracle introduced automatic shared memory management. Setting only SGA_TARGET=x without defining limits for the SGA-components (buffer cache, shared pool, large pool, java pool) allows your database to redistribute SGA memory between components due to current needs. This will work properly in many cases but sometimes there are some pitfalls: A very common problem on Oracle databases are applications without usage of bind variables in their SQL statements. Not using bind variables leads to excessive SGA memory consumption in shared pool and parse effort if you have a large number of SQLs executed with different values in filter conditions stored as literals. For example: SELECT a, b FROM Item WHERE ItemNo = 453612; SELECT a, b FROM Item WHERE ItemNo = 876886; etc. instead of SELECT a, b FROM Item WHERE ItemNo = :ItemNo; In such a situation the DB may resize the SGA. The size of the shared pool will grow thus reducing the size of the buffer cache...

Oracle-DB: Evaluation of recorded SQL-Monitor reports with Panorama

Image
SQL-Monitoring records individual executions of an SQL statement in detail if they fulfill one of the following prerequisites: Execution with parallel query CPU- or I/O-activity for more than 5 seconds Optimizer-hint `MONITOR` in SQL statement SQL-Monitoring reports are stored in table v$SQL_Monitor during SQL execution and for a very short period after execution. The precondition for using the monitoring reports is licensing of the Tuning Pack for the Enterprise Edition. Starting with Oracle 12.1, the short-living detailed monitoring reports from v$SQL_Monitor are also available for a longer time within the AWR retention period via DBA_Hist_Reports and DBA_Hist_Reports_Details. This report can be exported as HTML-page which uses Adobe-Flash to render the Database Activity Report for this SQL execution similar to Enterprise manager. To generate the HTML-report from v$SQL_Monitor call: SELECT DBMS_SQLTUNE.report_sql_monitor( ...

Panorama: Handle SQL patches for Oracle-DB

Image
Long time ago Oracle introduced SQL patches as a way to influence execution plan of SQL with optimizer hints without changing the original SQL statement. This allows fixing execution plan issues without any change at the application executing this SQL. SQL patches don't require additional license in contrast to SQL plan baselines and SQL profiles and can also be used with Standard Edition. SQL patches are normally used in workflow of SQL Repair Advisor but can also be created manually. There are two variants to create a SQL patch for a SQL: By SQL-ID and by SQL text. (See also this posts: 1   2  ) I personally prefer SQL patch creation using SQL text because SQL-ID requires existence of SQL-Statement in SGA at SQL patch creation time. For Oracle 11.1 .. 12.1 create with package-method sys.DBMS_SQLDiag_Internal.i_create_patch BEGIN sys.DBMS_SQLDiag_Internal.i_create_patch( sql_text => 'SELECT SYSDATE FROM DUAL', hint_text => 'PARALLEL(8)...

Panorama: Do I need Diagnostics Pack and Tuning Pack license to use Panorama?

This post describes how Panorama allows usage without violating Oracle's license conditions if you don't have Diagnostics Pack and Tuning Pack license. You can run Panorama with access on original AWR/ASH (which requires EE and Diagnostics Pack) or with access on Panorama's own sampled history data which doesn't require EE and Diagnostics Pack. Before accessing AWR/ASH-data Panorama asks you which mode you want to use. Several functions of Panorama require one of the following: Enterprise Edition and Diagnostics Pack licensed or Use Panorama's own data sampled by Panorama-Sampler instead Panorama's function "SQL monitor" is available only if you've licensed Oracle's "Tuning Pack". Accessing restricted dictionary data (like AWR) with Panorama has preconditions to ensure compliance with Oracle's license conditions: After connecting to a database with Panorama you have to acknowledge at first one of the four options:...

Oracle-DB: AWR and ASH for Standard Edition / without Diagnostics Pack

Image
Panorama is my free performance analysis tool for Oracle-DB. From now it offers it's own database workload recording 'Panorama-Sampler' as alternative to use of Oracle's origin AWR and ASH data. This enables you to use Panorama's functions for evaluation of historic workload info: with any database edition including Standard Edition without licensing of Diagnostics Pack for Enterprise Edition In addition to Oracle's AWR Panorama-Sampler may also record historic information for: Size evolution of tablespace objects Usage of DB-cache by objects Detailed info for blocking lock scenarios You may find more about Panorama and it's sampling feature including download link at: http://rammpeter.github.io/panorama_sampler.html http://rammpeter.github.io/panorama.html

Oracle-DB: How to check for appropriate sequence caching

Image
A common pitfall while using sequences in Oracle-DB is forgetting to define sequence caching. The default for sequences is cache size = 0. That means, every sequence.nextval operation triggers a single write operation on dictionary table sys.SEQ$. Especially if frequently calling sequence.nextval uncached sequences may cause significant performance degradation. Frequently calling sequence.nextval in parallel sessions may lead to ramdom lock scenarios in library cache. Setting a cache size for a sequence may heavy increase performance of nextval-operations. There's a minimal memory overhead for caching a sequence because all that's needed is a counter to increase in SGA memory and a upper limit. If this limit is reached with the counter, the upper limit is increased by cache size and the new upper limit is written down once to SEQ$. The possible drawback for sequence caching is that you loose all your values between the current value and the highest cached value if yo...

Oracle-DB: Identify unused indexes

Image
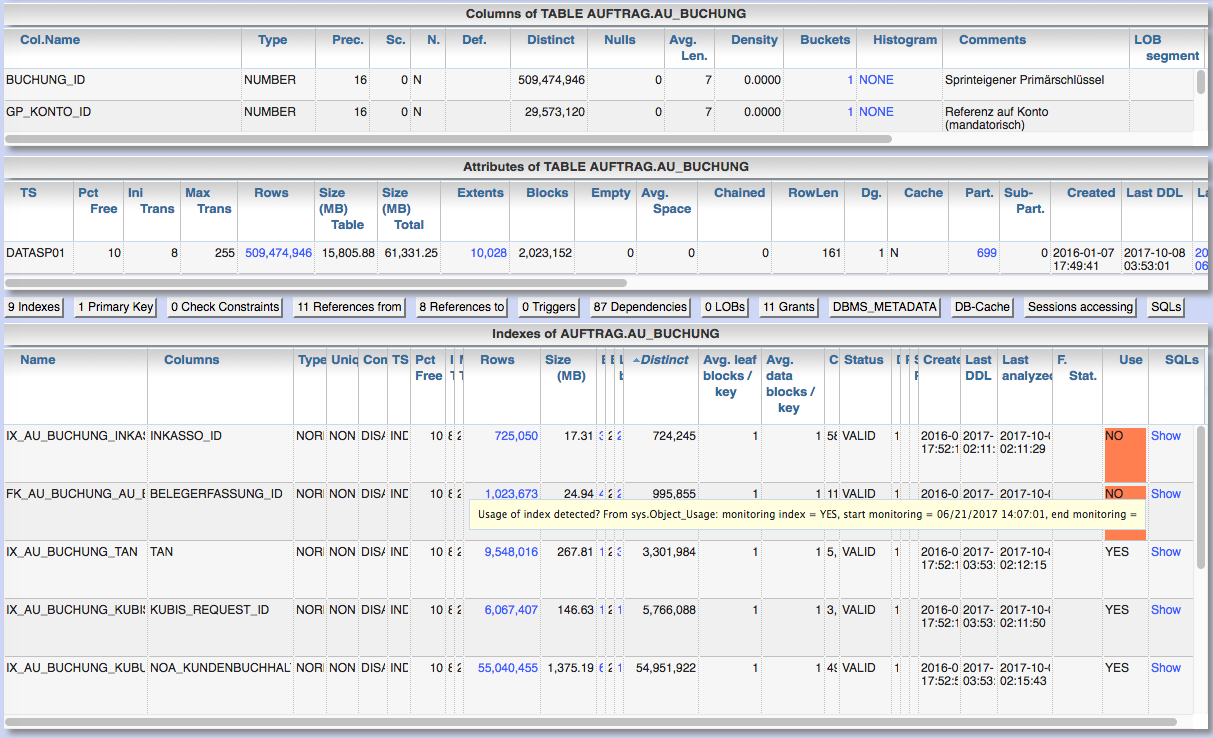
A common problem with indexes is: creating an index is quite easy in consideration of the possible impact deleting an index is much more difficult because: Who has the heart to decide this index is really no longer needed?  This results in: Nearly every database system stores and maintains indexes that are not really needed. In worst cases this not needed indexes are more than half of the systems total storage Securely indentifying and deleting this unnecessary indexes may be a strong lever to improve performance and reduce resource consumption without any changes on application. How to identify unused indexes: 1. Use Oracle's own index usage monitoring  You can enable index usage monitoring by issueing  ALTER INDEX <Index_Name> MONITORING USAGE; Index usage is expressed as YES/NO-state that flips to YES if index is used by any executed SQL-statement. Combined with start monitoring timestamp you can identify indexes that are not used by SQL si...

Oracle-DB: Use "SQL Translation Framework" to quickly fix problems with SQLs

Image
SQL Translation Framework is one of the more hidden features of database release 12.1. It allows to completely replace SQL text with replacement text before processing this SQL. Primary aim for SQL Translation Framework is migrating client applications from other SQL dialects, but it is also a sharp weapon for performance troubleshooting. Compared with SQL plan baselines or SQL profiles it is not restricted to execution plan or optimizer hints, instead allows to replace the complete SQL text. This way this framework allows to fix any possible issues that may be solved by changes on SQL text without any change on the application executing the SQL.  You can rewrite the whole SQL-statement, e.g. add missing JOIN- or WHERE-conditions, extract parts into WITH-clause etc. Limitations for SQL text replacements are only: the result structure (number, order and types of result columns) must remain stable the bind variables must also remain stable regarding number, alias, order ...

Scan Oracle-DB for excessive execution of SQL with literals instead of bind variables

Image
Using literals instead of bind variables in SQLs may have several drawbacks: Performance slows down because of: worse cache hit ratio higher parse effort Growing SQL-area in shared pool pushes other major memory objects outside, especially DB-cache Each executed SQL has to be hard parsed separately Risk of SQL-injection may exist (depending from source of literal) Methods to find heavy executed SQLs with missing bind variables 1. Scan active session history for different SQL-ID but same execution plan WITH Ret AS (SELECT :Consider_Days_Back Days FROM DUAL) SELECT x.SQL_Plan_Hash_Value, x.Different_SQL_IDs, x.Last_Used_SQL_ID, u.UserName, x.First_Occurrence, x.Last_Occurrence, x.Elapsed_Secs FROM ( SELECT h.SQL_Plan_Hash_Value, COUNT(DISTINCT h.SQL_ID) Different_SQL_IDs, MAX(h.SQL_ID) KEEP (DENSE_RANK LAST ORDER BY h.Sample_Time) Last_Used_SQL_ID, User_ID, MIN(h.Sample_Time) First_Occurrence, MAX(h....

Panorama: Explore free space fragmentation of tablespaces

Image
Unfortunately the number of free bytes in your tablespaces does not really ensure that you are still able to allocate new extents in tablespace. Except you have choosen UNIFORM EXTENT SIZE as allocation type, than your free space chunks may not be smaller than your uniform extent size and you can skip here. To allocate a new extent on one of your tablespace's objects you must ensure that there is an existing contiguous chunk of free space that your extent may totally fit in. With Panorama  you are enabled to explore with one click the fragmentation of your tablespace and remaining space for different extent sizes. There may be a remaining question: With what size will the next extent be created for my table or index to estimate wether it will fit in free space? You can recognize this by exploration of the existing extents of your object and the assumption that the next extent will be created with: the size of the largest existing extent for SYSTEM allocation t...

Common pitfalls using SQL*Net via Firewalls

It's very common that firewalls are terminating idle TCP sessions after a limited time, often after approximately one hour. Possible problem If you have a long running SQL or PL/SQL program and the firewall terminates your apparently idle TCP session this may lead to the following scenario: the database is not able to send result to client. After reaching the TCP-timeout the database server terminates the DB-Session the client program stays in socket read forever waiting for the database response Oracle's full solution: SQLNET.EXPIRE_TIME=x in sqlnet.ora Oracle's solution for this problem is setting parameter SQLNET.EXPIRE_TIME=x in sqlnet.ora where x are the minutes between keep alive packets on idle sessions that inform the firewall that this session is always alive. SQLNET.EXPIRE_TIME hast to be set in the sqlnet.ora of your RDBMS' ORACLE_HOME. Normally $ORACLE_HOME/network/admin. If you have a grid infrastructure setting SQLNET.EXPIRE_TIME in sqlnet...

Oracle-DB: Does Active Session History always allows you to reconstruct your active sessions behaviour?

Image
As the name implies one would expect that Active Session History records all information to reconstruct the main activities of sessions that are active for a longer period. Is it really true? I thought so before, but it isn't. Consider the ASH-chart of this session running for approx. one hour as one unique PL/SQL package-method call. What you would expect is that over this time the session is always active doing PL/SQL- or SQL-execution work. That means this session is permanently active and wait states should be recorded in ASH. But ASH-report says that this session is mostly inactive consuming time but doing nothing on database. The reason for this confusion is: Active Session History does not record wait states for wait class "idle". In this special case the idle waits are caused by one frequently executed SQL-statement accidentially forced to run in parallel query mode by a PARALLEL-hint, but each SQL-execution took only some milliseconds. If you ...

Oracle-DB: Identify excessive logon/logoff operations with short-running sessions

Image
Creating and destroying database sessions in loop may lead to significant database load. This blog post contains more about quantifying this load. Applications should use connection pooling at client or database side to prevent excessive session creation. But how can I identify the client processes causing this sessions? Scan DBA_Audit_Trail to identify context info If auditing logon/logoff-operations is activated for your database, scan DBA_Audit_Trail. You can do this by 2 was: Alternative 1: Use my tool "Panorama" to evaluate audit trail Panorama is available here. Go to menu "DBA general" / "Audit Trail": Select start and end time for selection Filter column "Action" for "LOGON" Set "Grouping" to "Minute" Execute selection via button "Show audit trail" Add columns of your choice to diagram by context menu (right mouse button) This way you can identify the machine, DB-user ...

Common Oracle DB pitfall: too few redo log groups

Image
Running an Oracle database with only 3 redo log groups often leads to suddenly frozen database, there all commit operations are suspended for some seconds or even some minutes. This freeze behavior may cause several errors in production environments: Services are not available, timeout exceptions are raised, process throughput decreases considerably etc. . Unfortunately only 3 redo log groups is the default for a database created by DBCA and therefore you may find many DB instances in production with only 3 redo log groups. But why should it be a problem to have too less redo log groups? For example we have a database with 3 redo log groups and as advisable for production databases, archiver mode is activated. Consider the redo logs as ring buffer where a fix number of redo log file groups is reused by the log writer process after the current log is completely written and a log switch is raised. The precondition for successful log switch is that the next log file group to s...

Panorama is available now as Docker image

Image
Panorama can be run as Docker image from now. It is available at dockerhub ( https://hub.docker.com/r/rammpeter/panorama ) and can be fetched by docker pull rammpeter/panorama You may run Panorama immediately by executing docker run --name panorama -p8080:8080 -d rammpeter/panorama More information about Panorama and how to customize your Docker container you may find at: http://rammpeter.github.io/panorama.html

Analyze pluggable database with Panorama

Panorama now supports analysis of pluggable databases (PDB) too. Visibility of informations in CDB and PDB There are different informations visible wether you are selecting from DBA_xx-views or CDB_xx-views and your are connected to CDB or PDB Role / user connected Container-DB (CDB / root) Pluggable database (PDB) Kind of views CDB_xx DBA_xx CDB_xx DBA_xx system all PDBs including root all PDBs including root nothing your current PDB user (SELECT ANY DICTIONARY) all PDBs including root root CDB nothing your current PDB Posted on  "Analyze pluggable database with Panorama"