Posts

Oracle-DB: Does Active Session History always allows you to reconstruct your active sessions behaviour?

Image
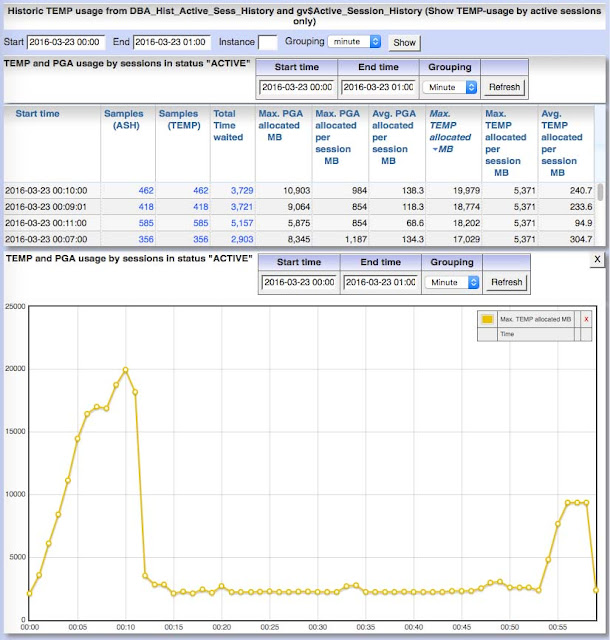
As the name implies one would expect that Active Session History records all information to reconstruct the main activities of sessions that are active for a longer period. Is it really true? I thought so before, but it isn't. Consider the ASH-chart of this session running for approx. one hour as one unique PL/SQL package-method call. What you would expect is that over this time the session is always active doing PL/SQL- or SQL-execution work. That means this session is permanently active and wait states should be recorded in ASH. But ASH-report says that this session is mostly inactive consuming time but doing nothing on database. The reason for this confusion is: Active Session History does not record wait states for wait class "idle". In this special case the idle waits are caused by one frequently executed SQL-statement accidentially forced to run in parallel query mode by a PARALLEL-hint, but each SQL-execution took only some milliseconds. If you

Oracle-DB: Identify excessive logon/logoff operations with short-running sessions

Image
Creating and destroying database sessions in loop may lead to significant database load. This blog post contains more about quantifying this load. Applications should use connection pooling at client or database side to prevent excessive session creation. But how can I identify the client processes causing this sessions? Scan DBA_Audit_Trail to identify context info If auditing logon/logoff-operations is activated for your database, scan DBA_Audit_Trail. You can do this by 2 was: Alternative 1: Use my tool "Panorama" to evaluate audit trail Panorama is available here. Go to menu "DBA general" / "Audit Trail": Select start and end time for selection Filter column "Action" for "LOGON" Set "Grouping" to "Minute" Execute selection via button "Show audit trail" Add columns of your choice to diagram by context menu (right mouse button) This way you can identify the machine, DB-user

Common Oracle DB pitfall: too few redo log groups

Image
Running an Oracle database with only 3 redo log groups often leads to suddenly frozen database, there all commit operations are suspended for some seconds or even some minutes. This freeze behavior may cause several errors in production environments: Services are not available, timeout exceptions are raised, process throughput decreases considerably etc. . Unfortunately only 3 redo log groups is the default for a database created by DBCA and therefore you may find many DB instances in production with only 3 redo log groups. But why should it be a problem to have too less redo log groups? For example we have a database with 3 redo log groups and as advisable for production databases, archiver mode is activated. Consider the redo logs as ring buffer where a fix number of redo log file groups is reused by the log writer process after the current log is completely written and a log switch is raised. The precondition for successful log switch is that the next log file group to s

Panorama is available now as Docker image

Image
Panorama can be run as Docker image from now. It is available at dockerhub ( https://hub.docker.com/r/rammpeter/panorama ) and can be fetched by docker pull rammpeter/panorama You may run Panorama immediately by executing docker run --name panorama -p8080:8080 -d rammpeter/panorama More information about Panorama and how to customize your Docker container you may find at: http://rammpeter.github.io/panorama.html

Analyze pluggable database with Panorama

Panorama now supports analysis of pluggable databases (PDB) too. Visibility of informations in CDB and PDB There are different informations visible wether you are selecting from DBA_xx-views or CDB_xx-views and your are connected to CDB or PDB Role / user connected Container-DB (CDB / root) Pluggable database (PDB) Kind of views CDB_xx DBA_xx CDB_xx DBA_xx system all PDBs including root all PDBs including root nothing your current PDB user (SELECT ANY DICTIONARY) all PDBs including root root CDB nothing your current PDB Posted on  "Analyze pluggable database with Panorama"

Don’t flood Oracle-DB’s result cache

Image
Caching SQL result sets or PL/SQL function results is very easy by done simply adding hint or flag “RESULT_CACHE”. Without monitoring the usage of result cache this may lead to overbooking the size of result cache. In excessive manner flooding the result cache with new entries may result in significant latch waits. This latch waits will influence other concurrent sessions and occur also for sessions using only few result cache entries. You should pay attention to size result cache according to your needs and avoid massive crowding out. So using only 80% to 90% of result cache is a good rule of thumb to avoid the risk of latch waits on result cache. Example problem: Consider the following PL/SQL-Function that computes something possibly time dependent: FUNCTION getCachedValue p_Parameter1 IN NUMBER, p_Parameter2 IN NUMBER DEFAULT NULL, p_Date IN DATE DEFAULT SYSDATE ) RETURN VARCHAR2 PARALLEL_ENABLE RESULT_CACHE; With usage in PL/SQL code but ignoring the time depen

Clarify myths of indexing foreign key constraints on Oracle-DB

If you use foreign keys there’s one very common dogma: You always need to index all the column(s) for which you define a foreign key constraint! I definitely do not agree with this dogma and want to explain why. There are two reasons for indexing columns with foreign key constraints: Avoiding full table scans on referencing table during deletes on referenced tables  Avoiding blocking lock problems e.g. if you are doing DML on both referencing and referenced table  You may find a detailed description of the locking behaviour of foreign keys at chapter "Locks and Foreign Keys" here in the Oracle documentation . Considerations on full table scan due to foreign key constraint not protected by index If you do not index referencing column(s) than delete on referenced table leads to a full table scan on referencing table for every deleted row  Therefore you should index referencing column(s) especially in OLTP-environments if your referenced table has more than a small

Panorama: Save request parameter to recall page with specific filters at later time

Image
Sometimes in Panorama you have drilled down in analysis from step to step, cumulated several filter conditions and found what you are looking for. This finding you want to share with colleagues or store for later use. Panorama allows you at several pages to copy your current request parameter to clipboard and use ist later to reconstruct your current page. Saving request parameters: Choose “Copy request parameters to clipboard” from small menu at left corner of headline (if it is available for this function). You can use parameters from clipboard now to store or mail or … Restore a page with given parameters: Call menu “Spec. additions / Execute with given parameters” and paste your stored parameters in text area. Click execute to restore your page with this parameters.

Generate recommendation lists for index compression on Oracle-DB

Image
An often underrated feature of Oracle databases since version 9i is  key compression for indexes . It allows reduction of index footprint until 1/2 of uncompressed size depending from key size and number of rows per key. Compressing an index is quite simple: ALTER INDEX MyIndex REBUILD COMPRESS; to compress all keys of an index or ALTER INDEX MyIndex REBUILD COMPRESS 2 to compress only the first two columns of an multicolumn index. But how to determine which indexes of an existing database system are worth compressing? You can generate weighted recommendation lists for index compression by executing the following SQL statements at your database with an user who has the grant SELECT ANY DICTIONARY. Version 1: Rate indexes by selectivity SELECT * FROM ( SELECT ROUND(i.Num_Rows/i.Distinct_Keys) Rows_Per_Key, i.Num_Rows, i.Owner, i.Index_Name, i.Index_Type, i.Table_Owner, i.Table_Name, t.IOT_Type, ( SELECT ROUND(SUM(bytes)/(10

Panorama: How to analyze blocking locks in Oracle-DB

Image
This article describes how to analyze blocking locking lock constellations just now in database and also back in history. Especially this includes the identification of database sessions that are initially causing hierarchic blocking lock dependencies. Analyze current blocking lock situation with Panorama Choose menu “DBA general” / “DB locks” / “Current”: Hit button “Blocking DML-Locks” You see a constellation of four sessions blocking each other wile accessing table EMPLOYEE. For each blocking lock you see the waiting session, the blocking session and also the root blocking session which causes the blocking hierarchy. If the blocking session of the lock is also the root cause for the blocking hierarchy than this blocking session is marked orange. That means that you have to clarify this orange sessions problem (probably by killing this session) to release the whole hierarchy of blocked sessions. Via link you can further view detailed info about: blocking and

Panorama: How to identify and evaluate SQL with different execution plans

Image
How to identify changing execution plans in Panorama Changing or alternating executions plans often contains the risk of unpredictable runtime for SQL-statements. There are several ways in Panorama to find SQL statements with different execution plans: 1. Lookup into current SGA: If you list SQLs from SGA (Menu „SGA/PGA details“ / „SQL-Area“ / „Current (SQL-ID)“), there’s the fifth column „P.“ in the table which shows the number of different plans in SGA for a SQL-statement (orange background if more than one plan occurred). 2. Lookup into SQL history: If you list historic SQLs from AWR history (Menu „SGA/PGA details“ / „SQL-Area“ / „historic“), there’s also a column „P.“ in the table which shows the number of different plans within the choosen period for a SQL-statement. 3. SQL details page for period in history At the SQL details page you find the number of different execution plans in the considered period at the right upper corner. 4. Complete time line of SQL A

Panorama: How to identify root cause after “ORA-1652: unable to extend temp segment”

Image
If you find this message “ ORA-1652: unable to extend temp segment ” in alert.log there are two alternatives for reason: The session causing the ORA-1652 has allocated large memory in temporary tablespace itself and got ORA-1652 at the end of available space  Other sessions did successfully allocate large amount of memory in temp tablespace but this session with only small demand got ORA-1652  But how to identify the session that really claimed large amounts in temporary tablespace and therefore is responsible for the ORA-1652? With Panorama you can clarify this as follows: Go to menu “Schema / Storage” / “Temp usage” / “Historic”. Choose the concerning period and appropriate time unit.  Sort table by column “Max. TEMP allocated”  Show column “Max. TEMP allocated” in diagram via context menu click in column and select “Show column in diagram”  Now let’s check the temp usage peak at 00:10. One of several ways to identify the sessions causing the peak is: Click

Panorama: Fix changed execution plan with SQL plan baseline

You recognize a long running query caused by poor execution plan. You also know that until yesterday this query worked fine but now execution plan has suddenly changed due to ???. Filipe Martins named a solution here by transferring a good execution plan from AWR history into a SQL plan baseline. This solution is available in Panorama now. It allows you to quickly generate a SQL snippet for creation of SQL plan baseline by simple button click. Steps to fix this issue: Identify the problematic query, open SQL details page in Panorama for this statement. For example via menu “SGA/PGA details” / “SQL Area” / “Current” Hit button “Complete time line of SQL” at the bottom of the SQL details page Identify a day (or hour/minute) in history in the list with exactly one good execution plan. Column “Elapsed/Execution” may help you to rate the quality. Column “Plan hash value” allows you to differentiate different plans. Click the link in column “Start time” to open SQL de

Panorama: User is enabled to add personal SQL to dragnet list

Image
In menu ‘Spec. additions’ / ‘Dragnet investigation’ now you have the opportunity to add your own personal SQL-statements to the predefined list of dragnet SQLs. This SQLs are stored at Panorama’s server instance and are available for your personal browser instance only. Choose ‘Add personal selection’ from menu ‘≡’ and customize the JSON template for your purpose. You will get a new menu ‘Personal extensions’ in your list of SQLs then. If you want to persist this SQLs and provide them to all users of your Panorama instance, you can store them as JSON-array in a file ‘predefined_dragnet_selections.json’ stored at PANORAMA_VAR_HOME. The content of file ‘predefined_dragnet_selections.json’ is shown in list of dragnet SQLs if it exists in   PANORAMA_VAR_HOME directory. Click here to show all opportunities for your personal or global extensions to dragnet list.

Set script name as module/action in V$Session if SQL*Plus-session starts

Setting module and action info via  DBMS_Application_Info.Set_Module  gives valuable context info in V$Session, Active Session History etc. For jobs executing SQL via SQL*Plus mostly needed information in module/action is the name of the process executing sqlplus. To prevent jobs from directly executing  DBMS_Application_Info.Set_Module  and to ensure that every sqlplus-process is setting this context info, you can use the startup-script feature via login.sql. Ensure that environment variable SQLPATH will target to the directory that contains login.sql, so all executions of sqlplus will  immediately set their context info in v$Session. Example for login.sql: -- Description : Default login sequence for SQL*Plus, executed at start time of every SQLPlus-process if file is in search path -- Unix environment variable SQLPATH must contain directory of file "login.sql" SET TERMOUT OFF; -- Determine unique session identifier for unique tempfile name

Monitor/sample values from gv$SesStat in history: monitor transaction count per session in history

In current version of Oracle database there’s no way to breakdown historic statistic values to sessions if session has already terminated. Some times this information is strongly needed to identify bottlenecks. Actual situation was: – massive number of transactions which caused massive small write I/O reaching limits of physical disks – to identify root cause identification fo processes/sessions was needed – consideration can only be done in history with time gap of some hours, problematic sessions have been terminated for long time Solution: Create sampling process with minimal resource impact to CPU and I/O with result storage in database table. Preparation Create two tables, one for result storage and one for abortion of sampling process: CREATE TABLE SessMon_Semaphore (Name VARCHAR2(30)); COMMENT ON TABLE SessMon_Semaphore IS 'Control abortion of sampling process'; COMMENT ON COLUMN SessMon_Semaphore.Name IS 'Record identifier to store record lock on it&